Dehari
Basic information
Sample name: Dehari
Reference: V. Parmar, G. V. R. Prasad, and R. Norboo. 2018. Middle Miocene small mammals from the Siwalik Group of Northwester India. Journal of Asian Earth Sciences 162:84-92 [ER 4081]
Geography
Country: India
State: Jammu and Kashmir
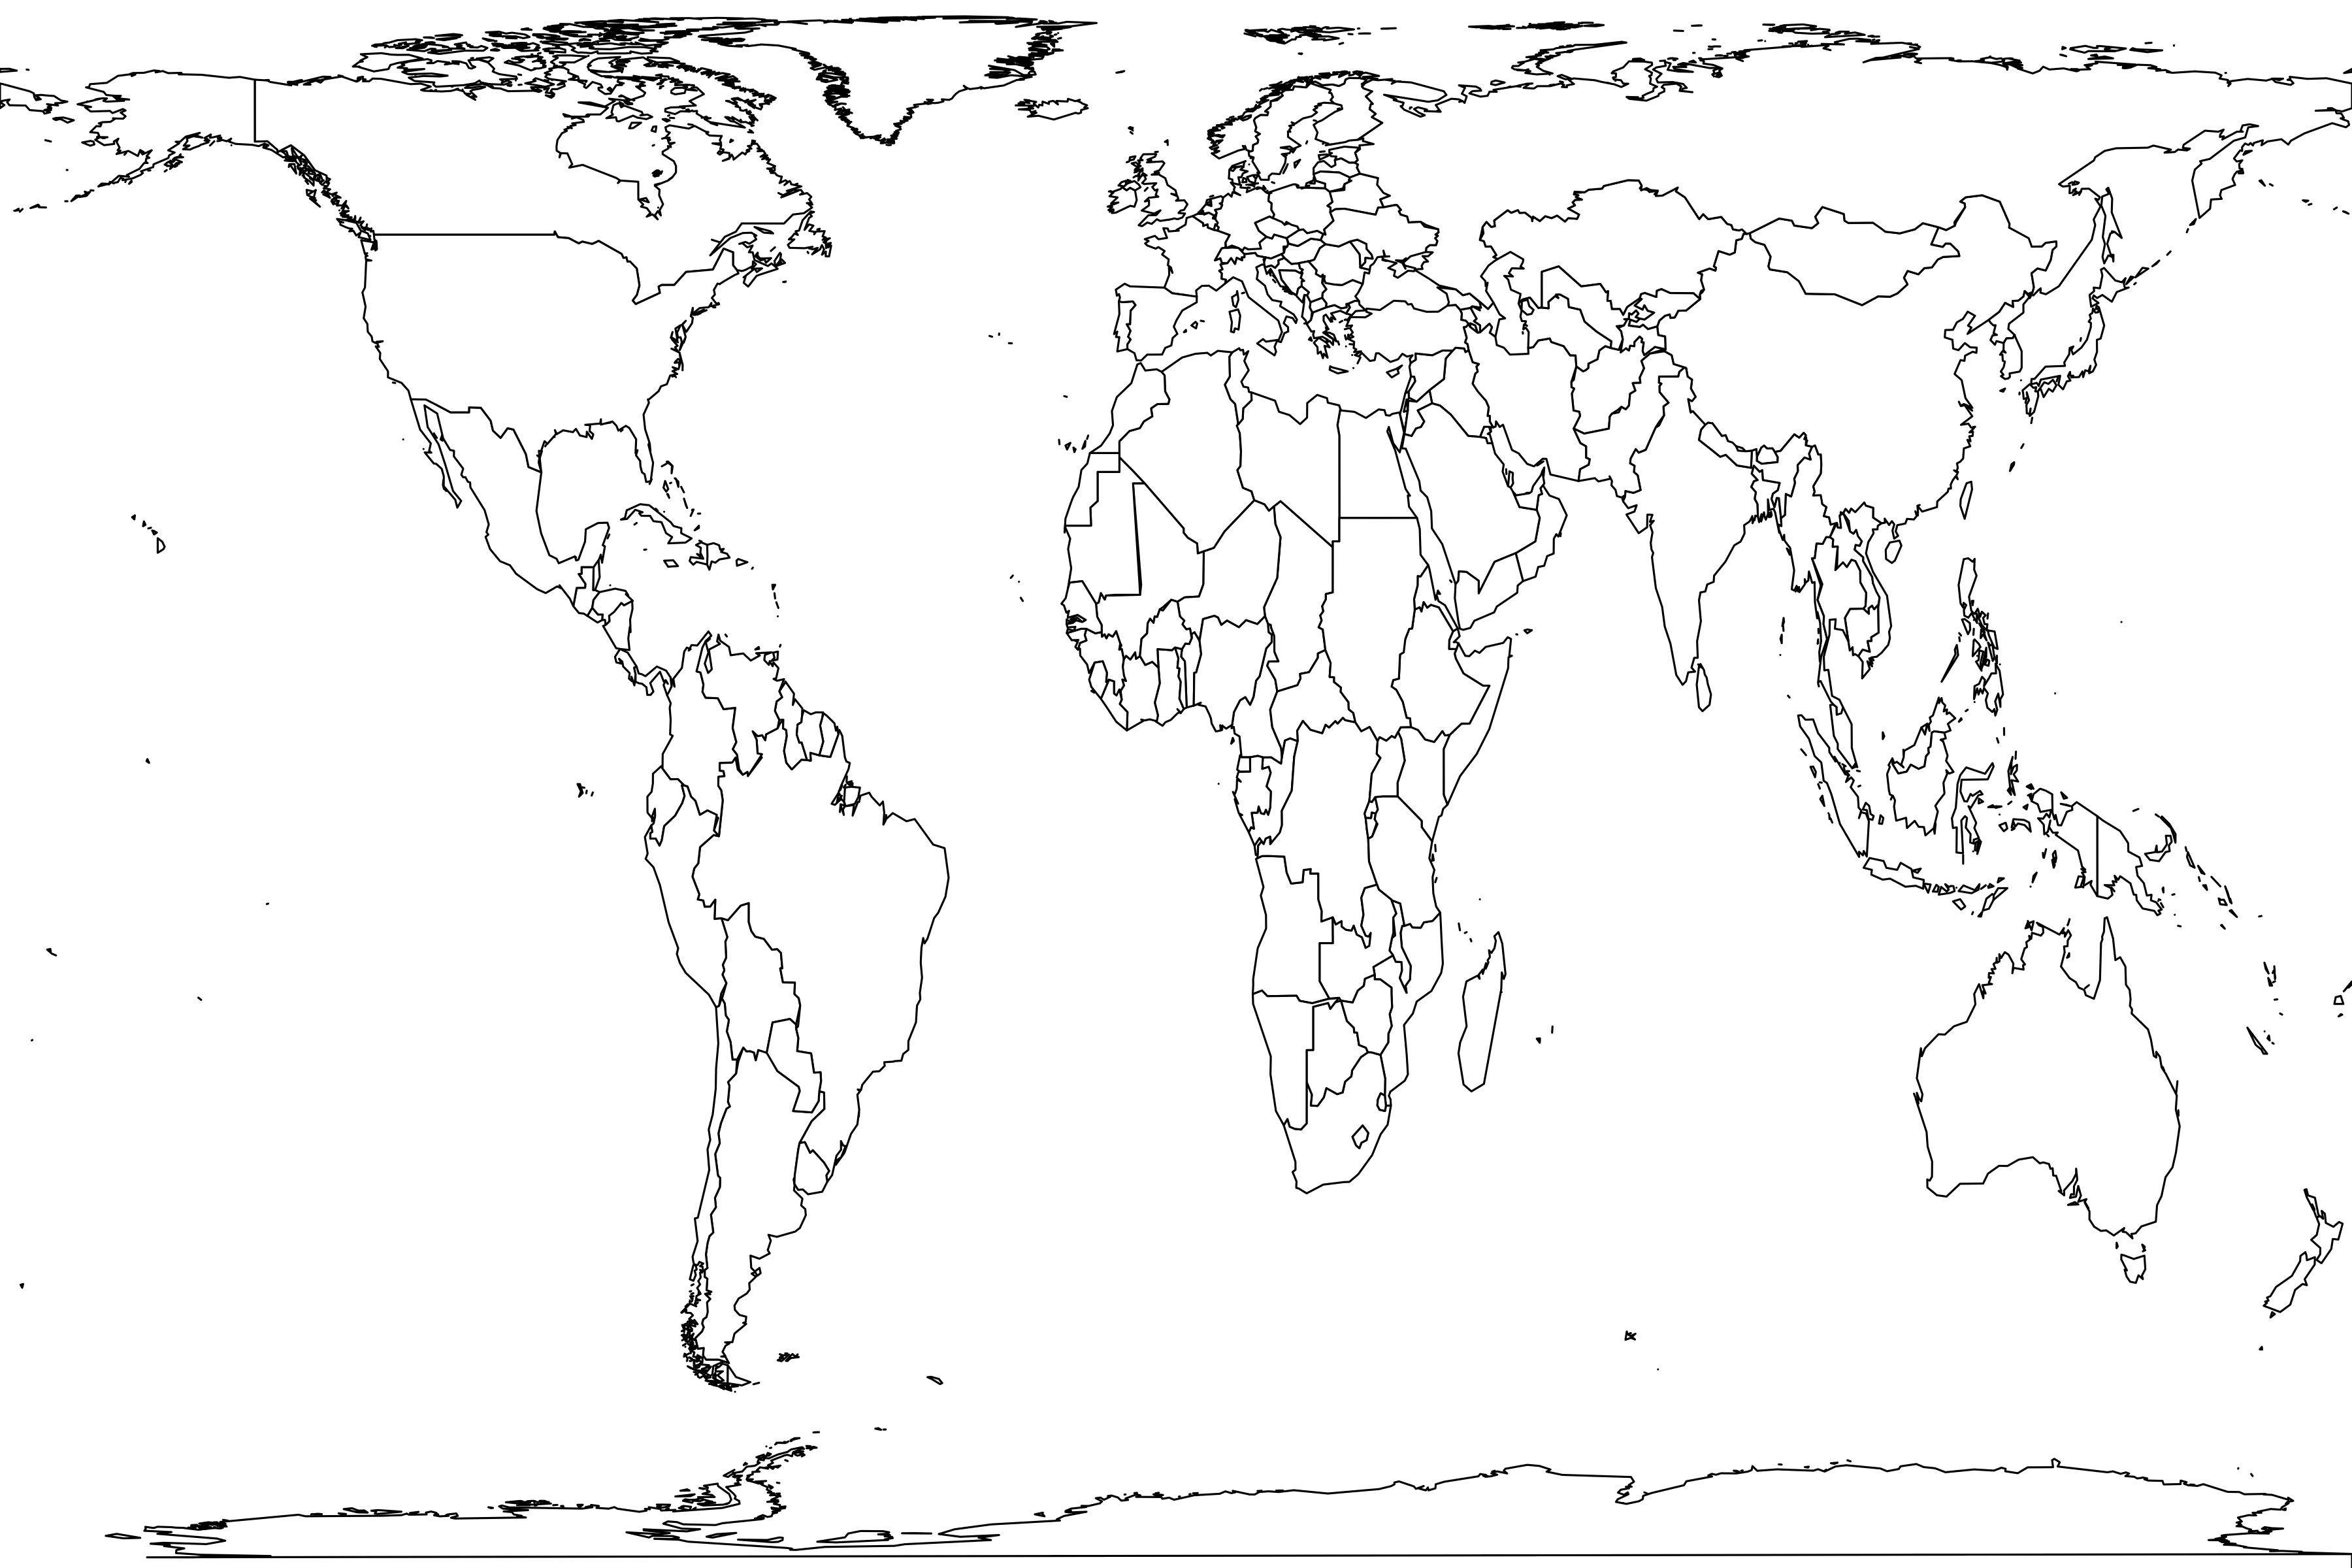
Coordinate: 32° 47' N, 75° 17' E
Coordinate basis: estimated from map
Scale: quarry
Formation: Mansar
Time interval: Middle Miocene
Zone: MN6
Geography comments: "from a single locality... about 0.5 km northeast of Dehari village on Ramnagar-Dhar road"
coordinate estimated from map in Fig. 1C
"an age of about 13.6–13.2 Ma is inferred for the rodent yielding horizon at Dehari" based on a miscalculation of ranges for these taxa based on data for the Siwalik Group of Pakistan: the actual concurrent range zone is 13.6 to 12.0 Ma, essentially MN6 and definitely Middle Miocene
Environment
Lithology: sandstone
Habitat comments: "grey, fine-grained sandstone at the base followed by a friable mudstone unit, gritty brownish-grey sandstone, and a brown mudstone at the top (Fig. 1C). The rodent fauna described here was recovered from the gritty brownish-grey sandstone bed"
Methods
Life forms: rodents
Sampling methods: quarry,screenwash
Sample size: 5 specimens
Museum: University of Jammu
Sampling comments: "About 200 kg of rock samples from Dehari site were collected for screen washing... The specimens described in the paper are housed in the Vertebrate Palaeontology Laboratory of University of Jammu"
sieve size was 60 mesh
sieve size was 60 mesh
Metadata
Sample number: 4506
Contributor: John Alroy
Enterer: John Alroy
Created: 2024-11-21 05:54:29
Modified: 2024-11-21 05:54:29
Abundance distribution
4 species
3 singletons
total count 5
geometric series index: 32.0
Fisher's α: 9.284
geometric series k: 0.7937
Hurlbert's PIE: 0.6500
Shannon's H: 1.3322
Good's u: 0.4857
Each square represents a species. Square sizes are proportional to counts.
• Find matching samples
Register


